PacSalmonEnvCov
Open-Source Data System for Pacific Salmon Environmental Covariates (PSEC)
Context
Population models for Pacific salmon (Oncorhynchus spp.) increasingly consider environmental covariates. Some of the widely used covariate series are publicly available (e.g. Pacific Decadal Oscillation index), and for some of them raw source data is published online (e.g., sea surface temperatures at British Columbia lighthouses). Data sets from published analyses are increasingly shared via github repositories or as supplementary files to the papers, but these are not routinely updated with new records.
Purpose
Despite the growing amount of environmental data available online, there is no centralized public source of directly usable environmental covariate series to support routine exploration and testing of hypotheses in salmon models. To address this gap, we are building an open-source data system using existing GitHub functionality.
Current Status
- 8 data set entries
- 46 covariate series, covering 20 to 125 years
- 5 notes (e.g., comparing PDO-based covariates)
- 22 discussion threads with open questions
Quick Links
- PSEC Repository - Main Page
- Contributed data sets
- Notes
- Discussion threads for open questions
- Wiki pages for background information
- Conference posters and presentations
Guiding Principles
Pacific Salmon Environmental Covariates (PSEC) focuses on building a data set and comprehensive context through collaborative development in a human-centered framework that minimizes technical obstacles for contributors. An open-source collaborative approach for building a data resource has great potential, but is also unpredictable and open-ended. Scope, structure, and contents of this resource will evolve through active contributions and debate.
Three guiding principles have shaped the evolution of the repository so far:
- Make it easy access to the data
- Make it easy to contribute data and context information
- Foster engagement with the data
Principle 1: Make it easy to access the data
Minimize technical barriers! Source files, compiled data set, and data descriptions should be directly available in a basic and universal file format, on a low-bandwidth site.
PSEC stores data in csv files and makes them available through GitHub. See Software Stack for details.
Principle 2: Make it easy to contribute data and context information
Allow for scalable effort! Requirements for initial contribution should be minimal, but within a structure that encourages gradual expansion and refinement with distributed workload.
The initial entry for a new data set can be just one or two basic files: a brief description text in a README.md markdown file and a csv file with the series. See Software Stack for details. In some cases, only the description file with some links can added as a start. Over time, the entry can then grow to include more details (data, code, summary of analyses).
The DFO Fraser Sockeye Forecast data set is a good example of a well-developed data entry.
The entry for the DFO Ocean Science Division Data Products Group is an example without any extracted data, just a description.
Principle 3: Foster engagement with the data
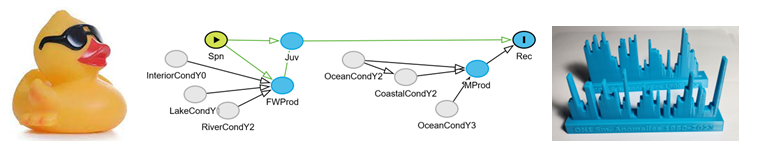
Environmental factors interact with salmon throughout their entire life cycle, but also interact with each other, creating complex causal pathways that can create serious pitfalls for your analyses. We are exploring tools that help individuals and teams work through these complexities: Ducks, DAGs, and Tangible Data

Rubber Duck Technique
The Rubber Duck Technique is a problem solving trick used in software development: Try to explain your code problem out loud to the rubber duck, and along the way you can catch flaws in your logic. The underlying idea is to use some device that forces you to convert technical details into simple, natural language, which changes how you think about the problem. The same technique can help us think through the thicket of potential covariates for salmon models.
PSEC uses the collaboration features of GitHub to encourage verbal thinking about environmental covariates in two ways:
- Discussion threads for specific questions or comments
- Short notes on broader topics that can be edited directly in your browser.
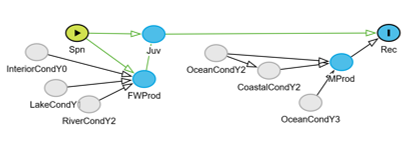
DAGs
Directed Acyclic Graphs (DAGs) are a graphical tool for thinking about causal relationships and building blueprints for quantitative models. DAGs focus on major pathways and directions of influence, setting aside specific relationships and numeric parameters for subsequent steps in the analysis. Think of DAGs as the bridge between a high-level verbal description and an initial version of the model code.
Tangible Data
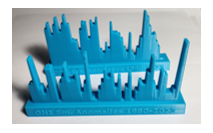
Even the most polished plots are still limited to page or screen. Interactive tools like Shiny Apps allow us to get closer to the data and look at it in different ways, but turning data series into tangible, physical objects can encourage even more active engagement. With the increasing accessibility of 3D printing this is becoming feasible on a small scale, and you can use R for the first step.
Software Stack
Software stack refers to all the programs and tools required to make an application work. The PSEC data system uses free open-source software and a free online platform. No software installations or logins are required to access the data and other materials. A free GitHub account is required to contribute data, post questions, or edit summary notes.
![]()
Individual source data and the merged file with all covariates are stored as csv files which work seamlessly across operating systems and software applications.
![]()
Background information and metadata are documented in the README.md for each data set. The README.md files use very basic markdown, which is automatically formatted for display by GitHub.
![]()
Data processing, merging, and exploratory analyses are all done with R code.
![]()
Tracking of updates and corrections handled automatically by GitHub. Also use GitHub discussion threads to resolve questions and GitHub Wiki pages for collaborative editing of background information.